Using -sts generate- to make -sts graph- coordinates
Aim
To show how to use -sts generate- and -twoway- as an alternative to -sts graph-.
Introduction
The result if -sts graph- is not a proper -twoway- graph.
When it is necessary to create more complicated graphs involving Kaplan-Meier, an -twoway- alternative is needed.
Here, it is shown how to get the exact same graph as -sts graph- using data points from -sts generate-.
Dataset
The example dataset can be found by:
webuse stan3, clear
Illustrating the difference
The data points can be generate by:
sts generate surv = s
label variable surv `"S(t+0), -sts generate-"'
Now the estimated points (_t, surv) are added to the -sts graph-
sts graph, addplot(line surv _t, sort connect(step) lcolor(red) lstyle(solid)) ///
        name(g1, replace) legend(order(1 "-sts graph-" 2 "-sts generate-") ring(0) position(1))
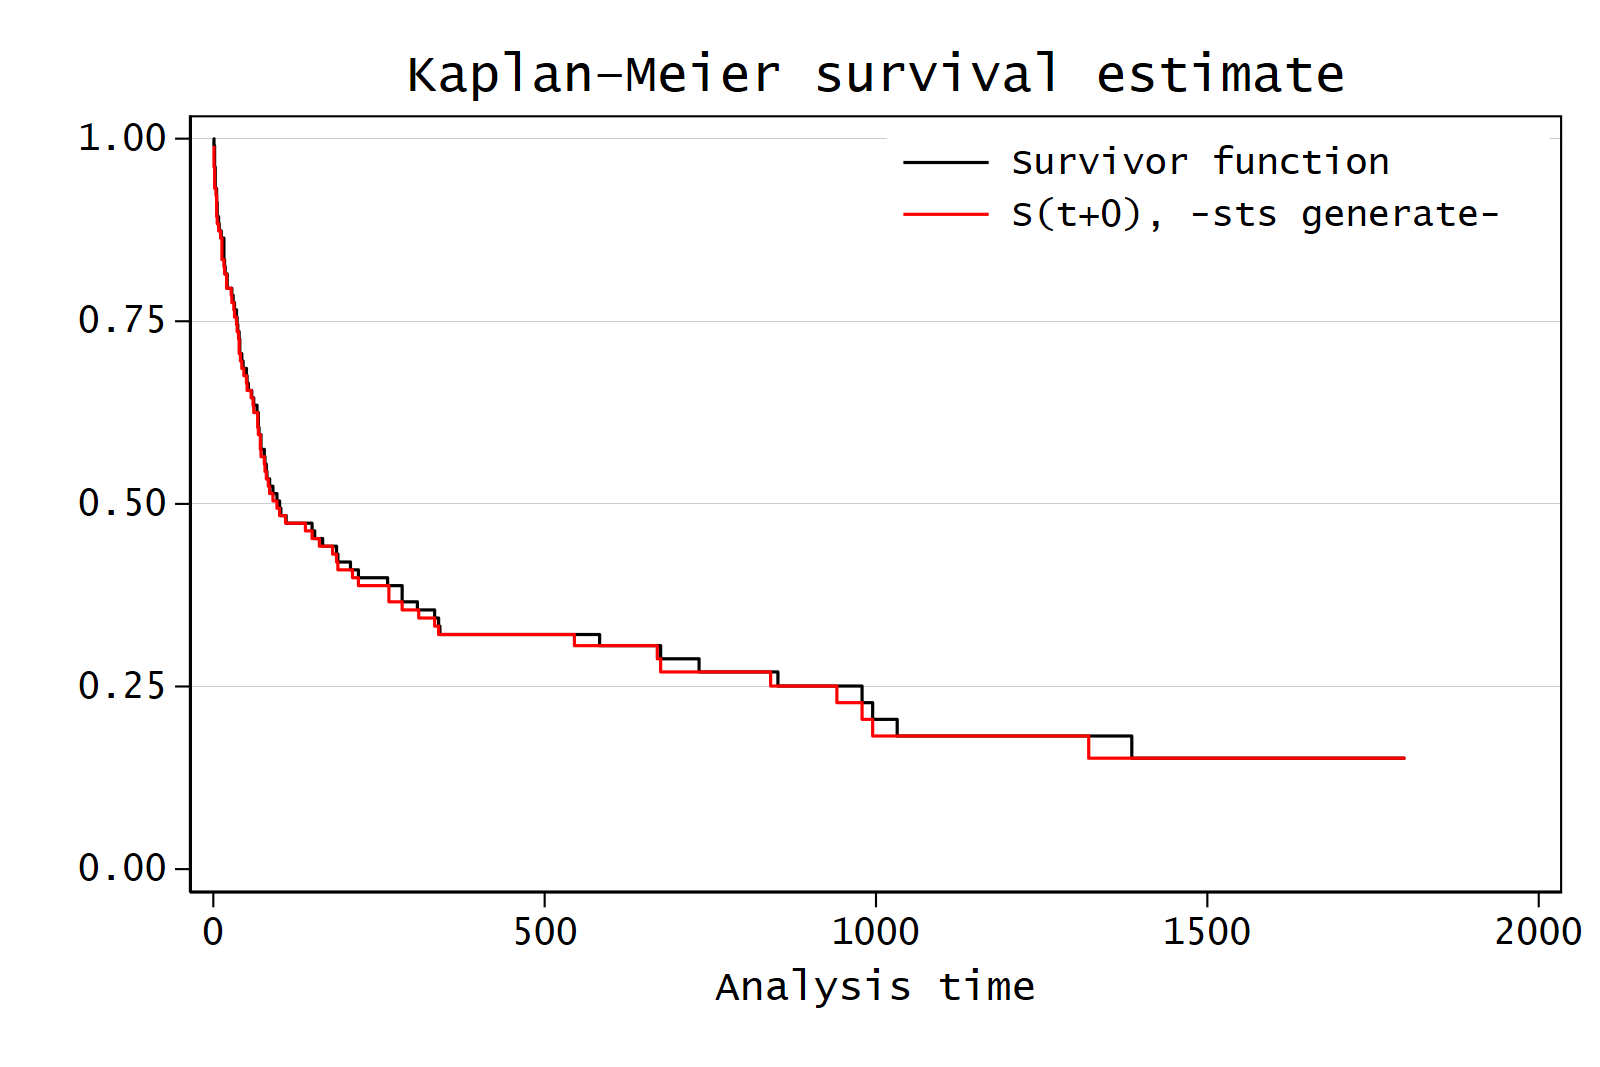
The remedy
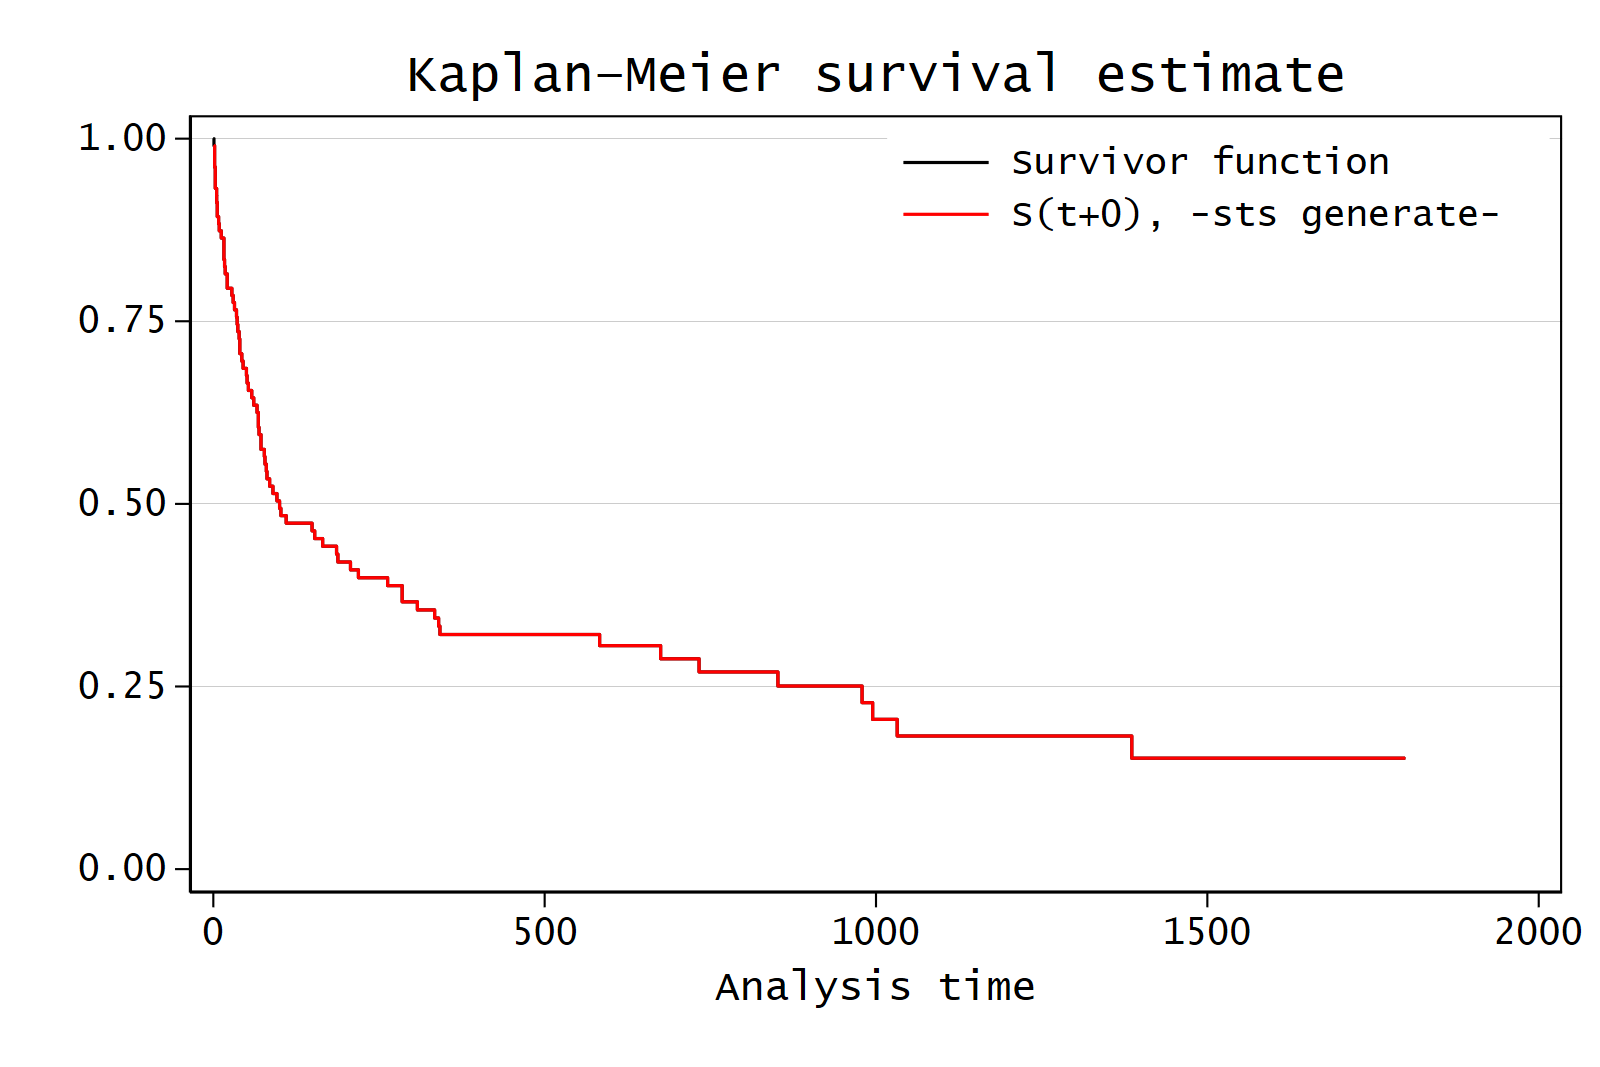
To make the two curves exactly alike a backwards time shift is needed.
This can be done by:
sort _t
generate _t_shift = _t[_n+1]
sts graph, addplot(line surv _t_shift, sort connect(step) lcolor(red) lstyle(solid)) ///
        name(g2, replace) legend(order(1 "-sts graph-" 2 "-sts generate-") ring(0) position(1))
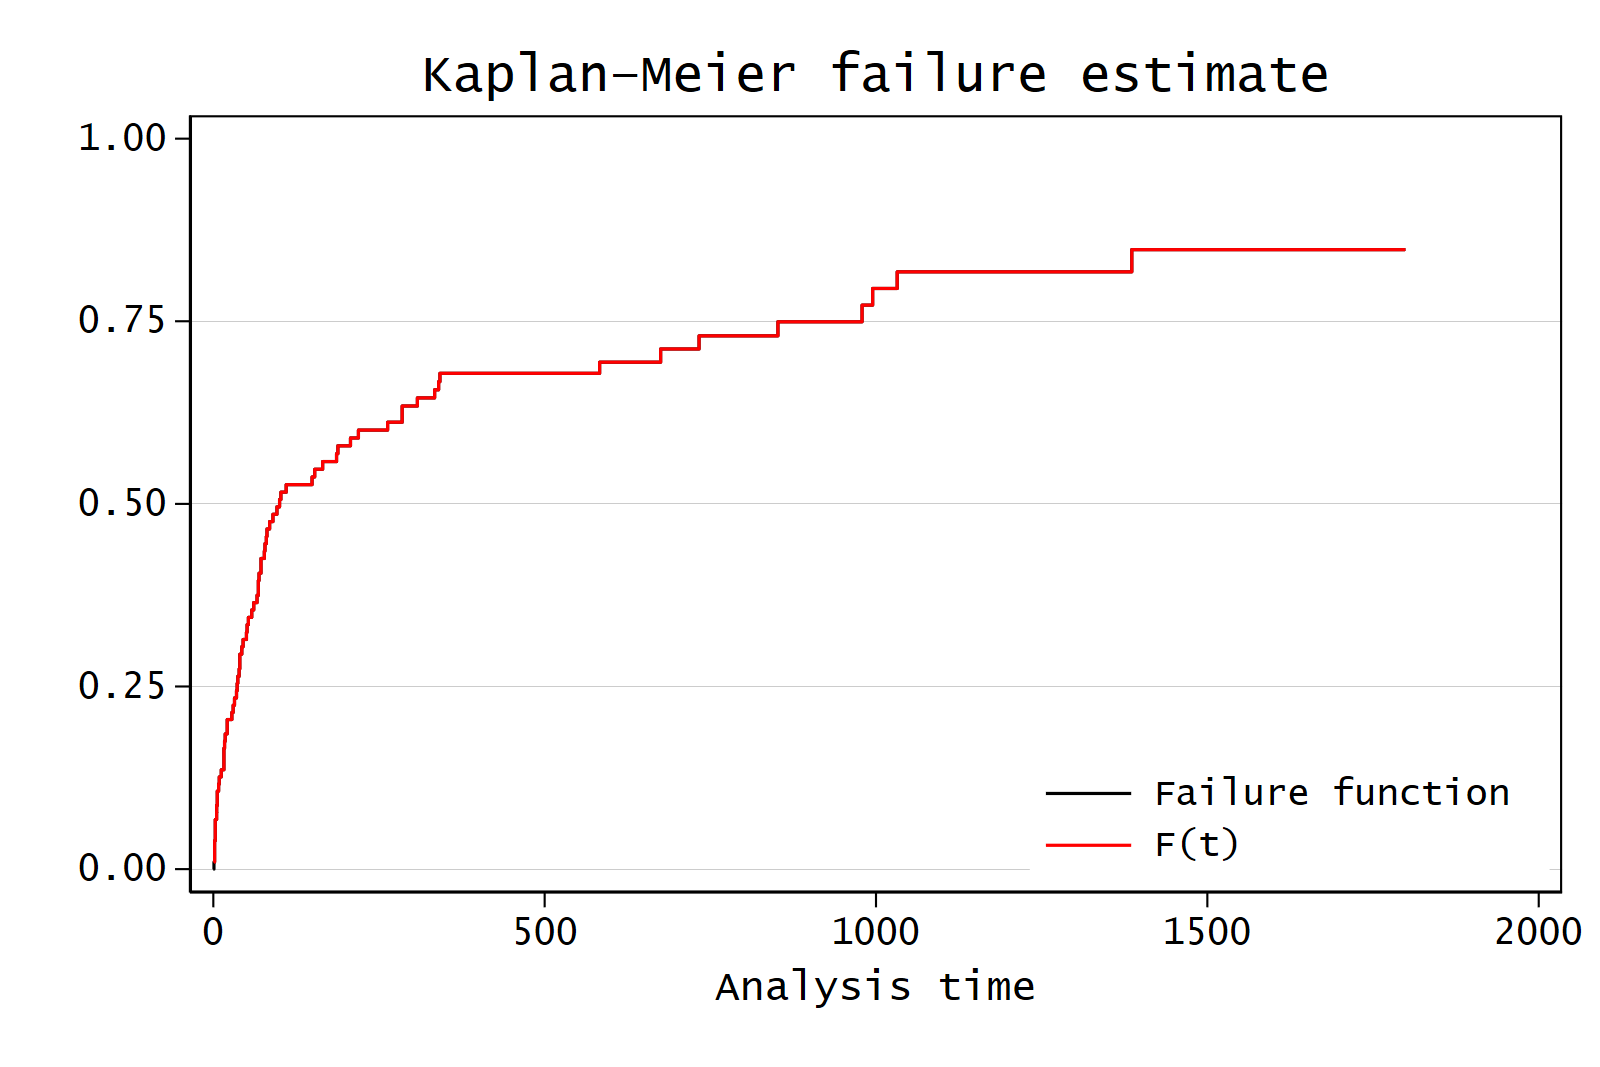
How to do failure curves
sts generate fail = f
label variable surv `"1 - S(t+0), -sts generate-"'
sts graph, failure addplot(line fail _t_shift, sort connect(step) lcolor(red) lstyle(solid)) ///
        name(g3, replace) legend(order(1 "-sts graph-" 2 "-sts generate-") ring(0) position(5))
Last update: 2022-04-18, Stata version 17